6 Step 6 – Interpret assessment results
What is the current status of the fishery?
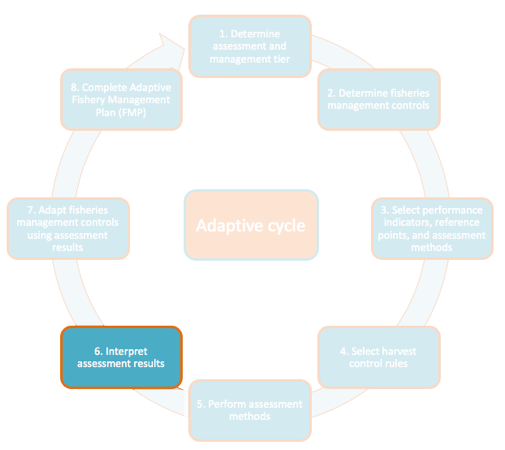
Figure 6.1: Step 6
6.1 Step 6a - Determine the Most Likely Possible Interpretation for Each Performance Indicator
After assessment methods have been completed, use your harvest control rule table to determine the possible interpretation and management implication for each performance indicator using the following steps:
Using your assessment results Step 5, use your harvest control rule table to look up the most likely interpretation from the choices provided in the “Possible Interpretation” column.
Once the most likely possible interpretation has been chosen, determine the management implication by locating the colored circle traffic light in the “Management Implication column”
6.2 Step 6b – Verify Assessment Result and Interpretation
Verify the assessment result using the following steps:
Double-check calculations by reviewing the assessment calculations.
Double-check that each assessment performed was stratified to the spatial extent of the fishery; for example, run analyses for each gear type, boat type, and/or fishing area.
Double-check that reference points are appropriate for your fishery using available literature, expert opinion, and local ecological knowledge
Review fishery-dependent sampling protocol; assess whether or not the spatial extent of the fishery-dependent survey overlaps with known or assumed distribution of fish population as well as fishing effort and gear type. If the sampling protocol, fish population, and fishing effort do not overlap, there may be biases in the assessment results that should be considering in your interpretation.
Review fishery-independent sampling protocol; assess whether or not the spatial extent of the fishery-independent survey overlaps with known or assumed distribution of fish population as well as fishing effort. If the sampling protocol, fish population, and fishing effort do not overlap, there may be biases in the assessment results that should be considering in your interpretation.
Examine any effort metrics to determine if they are consistent with your interpretation
Groundtruth assessment result and interpretation with community. Consult with local experts to determine if the assessment results align with their knowledge of the fishery (fishers, middlemen, village elders, academic research groups, etc.) Often, assessment results can be counterintuitive, and multiple performance indicators may be conflicting in their message. Fishers can be especially helpful in interpreting performance indicators that seem counter-intuitive but can be explained by fishermen behavior – for example, if fished:unfished density ratio is down but catch and CPUE are up, the fishermen might say that although fish abundance seems low (low fished:unfished density ratio) prices were high that season and the weather was good, resulting in better targeting (higher CPUE) and higher catches. This process can either take place in a focus group discussion or structured interviews with key stakeholders. Through this process, try to arrive at a consistent interpretation.
If trends persist, each performance indicator points towards a consistent interpretation, and if the community agrees with the interpretation, proceed to Step 7
In situations where conflicting indicators cannot be rectified, or if the community cannot corroborate the assessment results, additional community outreach or other forms of social marketing may be necessary to arrive at consensus. *It’s important that all stakeholders are comfortable and confident with the assessment interpretation because it will be used to trigger a harvest control rule in Step 7.