4 Step 4 – Define Harvest Control Rules

How should FMCs be adjusted according to the performance indicators of the fishery?
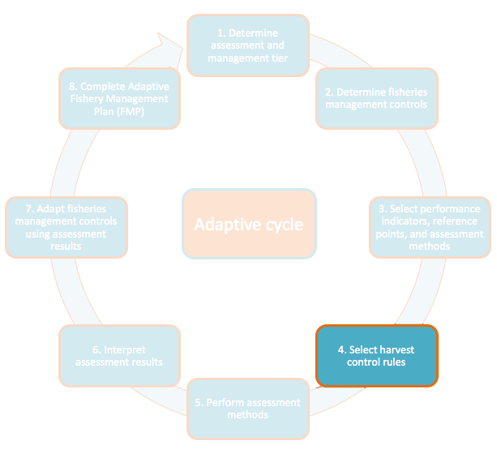
Step 4

Figure 4.1: Step 4

Harvest Control Rules (HCRs) will be used to adjust FMCs according to where the fishery’s performance indicators fall relative to their reference points. The HCR may specify some combination of adjustments to the FMCs that is expected to move the performance indicator towards the target reference point, and away from the limit reference point, therefore improving the performance of the fishery. While we provide guidance to define HCRs, it should be noted that HCRs should be based on realistic compliance and enforcement concerns and address community goals for your fishery (more guidance is provided in Step 4b).

It is important for stakeholders and managers to agree on the suite of HCRs in a safe and neutral setting before any management decisions need to be made. This can help improve compliance by ensuring management responses are objective, consistent, transparent, and appropriate. Therefore, it is important to identify all foreseeable possible scenarios that could occur in the fishery and create corresponding HCRs for each scenario.

4.1 Step 4a – Define General Harvest Control Rules for All Possible Interpretations

During this step, you will define general harvest control rules (for example, if the performance indicator is below the target reference point, reduce the total allowable catch). In the following step, you will add specificity to your harvest control rules (for example, if the performance indicator is 20% below the target reference point, reduce the total allowable catch by 20%). It is important that you define a HCR for every foreseeable interpretation so that management responses can be transparent and objective when the time comes to implement them.

Use Tabls 4.1, 4.2, and 4.3 as the framework for defining your general HCRs. The three tables contain the performance indicators that are associated with each tier and suggest HCRs from the literature. For each performance indicator and assessment result, the table lists a number of potential interpretations and corresponding HCRs. This table provides some examples, but is by no means comprehensive or prescriptive – it is illustrative only.

Each row also has a traffic light indicator that describes if a management response is necessary:

  • Green indicates that either no management response is necessary, or management could be even less restrictive.

  • Yellow indicates that a precautionary or more restrictive management response should be implemented.

  • Red indicates that the fishery should be closed and a fishery recovery plan implemented.

4.2 Step 4b – Add Specificity to Harvest Control Rules

During this step, you will add specificity to your HCRs (for example, if the performance indicator is 20% below the target reference point, reduce the total allowable catch by 20%). Be as specific as possible when defining the magnitude to which FMCs should be adjusted given the fishery’s performance indicator.

The magnitude that a HCR should adjust your FMC(s) will depend on:

  1. Productivity (life history) of the target species

    1. Productivity of key target species is an output of the FLAGS toolkit. This information may either come from a PSA result or a more data-limited qualitative approach for assessing species productivity.

    2. Species with low productivity will require higher, more restrictive levels of response when changes are necessary; species with higher productivity will require lower levels of response when changes are necessary

  2. Likelihood of compliance

  3. Social and political feasibility

  4. Enforcement capacity

  5. Level of uncertainty with data and the estimation of performance indicators,

    1. The more uncertain you are, the more precautionary you may want to make your management
  6. Risk tolerance.

    1. Communities with higher risk tolerance may choose to be more lenient when choosing HCRs, while communities with lower risk tolerance may choose more restrictive HCRs to be more precautionary in the face of changing and uncertain conditions.

You should consult any existing social survey data when setting HCRs. KAP data will provide an indication as to individual attitudes towards fishery management in your community. Social survey data will provide context as to how dependent the community is on the fishery and how changes in fisheries management controls may affect their livelihoods. Additionally, any existing enforcement data should be consulted to gain a better sense for the likelihood of compliance with any new regulations.

You should also consider the size of any NTZ when setting HCRs. Sites with a small NTZ relative to the size of the fishery may wish the exercise more precaution by setting more restrictive HCRs (i.e., if indicators are interpreted to mean poor fisheries performance, make more drastic adjustments to the FMCs). Sites with an NTZ that is not placed explicitly in areas that protect critical habitat may also wish to exercise more precaution with stricter HCRs. Sites with larger NTZs that protect a significant portion of critical habitat could be more lenient in their HCRs. Often, large and well-placed NTZs can act as a buffer against uncertainty and variability. By completely restricting access to a certain portion of the stock, marine reserves are analogous to an emergency savings account. Protecting a fraction of a fish stock in reserves reduces the risk of overfishing and the chance of stock collapse in the long term. Displaced fishing effort and unintended consequences resulting after implementation of a reserve can be mitigated when effective FMCs are in place outside of the reserve. When harvest levels are appropriately controlled a spillover of biomass from marine reserves to the adjacent fishery may occur that can benefit fisheries.

Table 4.1: Indicators for Tier 1: Possible interpretations, management implications, and suggested harvest control rules
Performan ce Indicator Assessmen t Result Interpret ation Result Managemen t Response

Fishing Gear

Destructive fishing practices being used

Non-destruc tive fishing practices are no longer able to efficiently catch fish and/or destructive fishing practices have not yet been banned

Yellow

  1. Ban destruc tive fishing practic es

No destructive fishing practices being used

Non-destruc tive fishing practices are able to efficiently catch fish and/or destructive fishing practices have been banned

Green

  1. If there is no reason to believe precaut ionary managem ent is necessa ry, make no changes to fisheri es managem ent control s *or
  1. Conside r precaut ionary managem ent by making fisheri es managem ent control s more restric tive (i.e., increas e TAC, increas e allowab le effort, add or modify certain control s, etc.)

Fishing Season

Increased variability in fishing season, or decreased fishing season

Ecosystem likely not healthy enough to support historical fishing season

Yellow

  1. Make fisheri es managem ent control s more restric tive (i.e., increas e TAC, increas e effort cap, add or modify certain control s, expand NTZ, etc.)

No changes in the fishing season

Ecosystem may be healthy enough to support historical fishing season

Green

  1. If there is no reason to believe precaut ionary managem ent is necessa ry, make no changes to fisheri es managem ent control s *or
  1. Conside r precaut ionary managem ent by making fisheri es managem ent control s more restric tive (i.e., increas e TAC, increas e allowab le effort, add or modify certain control s, etc.)

Target Species Composition

Change in composition of caught species (fewer species, more pelagics)

Ecosystem likely not healthy enough to support historical target species

Yellow

  1. Make fisheri es managem ent control s more restric tive (i.e., increas e TAC, increas e effort cap, add or modify certain control s, expand NTZ, etc.)

No change in composition of caught species

Ecosystem may be healthy enough to support historical target species

Green

  1. If there is no reason to believe precaut ionary managem ent is necessa ry, make no changes to fisheri es managem ent control s *or
  1. Conside r precaut ionary managem ent by making fisheri es managem ent control s more restric tive (i.e., increas e TAC, increas e allowab le effort, add or modify certain control s, etc.)

Species Vulnerabili ty

Target species have high vulnerabili ty

Target species have high susceptibil ity and/or low productivit y

Yellow

  1. Make fisheri es managem ent control s more restric tive (i.e., increas e TAC, increas e effort cap, add or modify certain control s, expand NTZ, etc.)

Target species have medium vulnerabili ty

Target species have medium susceptibil ity medium productivit y

Yellow

  1. Make fisheri es managem ent control s more restric tive (i.e., increas e TAC, increas e effort cap, add or modify certain control s, expand NTZ, etc.)

Target species have low vulnerabili ty

Target species have low susceptibil ity and/or high productivit y

Green

  1. If there is no reason to believe precaut ionary managem ent is necessa ry, make no changes to fisheri es managem ent control s *or
  1. Conside r precaut ionary managem ent by making fisheri es managem ent control s more restric tive (i.e., increas e TAC, increas e allowab le effort, add or modify certain control s, etc.)

Fished:unfi shed density ratio (for key target species)

Indicator >= Target

Fishing pressure appropriate for maintaining or improving the health of the ecosystem

Green

  1. Make no changes to fisheri es managem ent control s *or
  1. If trends have persist ed for more than one year and there is no reason to believe precaut ionary managem ent is necessa ry, make fisheri es managem ent control s less restric tive (i.e., increas e TAC, increas e effort cap, etc.)

Unfished area has a low density and does not represent a healthy virgin area (significan t illegal fishing is occurring within the NTZ)

Yellow

  1. Conside r improve d enforce ment of NTZ and

  2. Conside r targete d social marketi ng to improve complia nce with NTZ and

  3. Conside r precaut ionary managem ent by making fisheri es managem ent control s more restric tive (i.e., decreas e TAC, decreas e allowab le effort, add or modify certain control s, etc.)

Unfished area has a low density and does not represent a healthy virgin area (NTZ is new and has not yet led to substantial improvement s in ecosystem health)

Yellow

  1. Conside r precaut ionary managem ent by making fisheri es managem ent control s more restric tive (i.e., decreas e TAC, decreas e allowab le effort, add or modify certain control s, etc.)

Unfished area has a low density and does not represent a healthy virgin area (NTZ is small with large amounts of species movement between fished and unfished areas)

Yellow

  1. Conside r expansi on or relocat ion of NTZ and

  2. Conside r precaut ionary managem ent by making fisheri es managem ent control s more restric tive (i.e., decreas e TAC, decreas e allowab le effort, add or modify certain control s, etc.)

Target > Indicator > Limit

High fishing pressure putting ecosystem at risk for impending state change

Yellow

  1. Make fisheri es managem ent control s more restric tive (i.e., decreas e TAC, decreas e effort cap, add or modify certain control s, expand NTZ, etc.)

Environment al stochastici ty putting ecosystem at risk for impending state change

Yellow

  1. Conside r precaut ionary managem ent by making fisheri es managem ent control s more restric tive (i.e., decreas e TAC, decreas e allowab le effort, add or modify certain control s, etc.)

Unfished area has a low density and does not represent a healthy virgin area (significan t illegal fishing is occurring within the NTZ)

Yellow

  1. Conside r improve d enforce ment of NTZ and

  2. Conside r targete d social marketi ng to improve complia nce with NTZ and

  3. Conside r precaut ionary managem ent by making fisheri es managem ent control s more restric tive (i.e., decreas e TAC, decreas e allowab le effort, add or modify certain control s, etc.)

Unfished area has a low density and does not represent a healthy virgin area (NTZ is new and has not yet led to substantial improvement s in ecosystem health)

Yellow

  1. Conside r precaut ionary managem ent by making fisheri es managem ent control s more restric tive (i.e., decreas e TAC, decreas e allowab le effort, add or modify certain control s, etc.)

Unfished area has a low density and does not represent a healthy virgin area (NTZ is small with large amounts of species movement between fished and unfished areas)

Yellow

  1. Conside r expansi on or relocat ion of NTZ and

  2. Conside r precaut ionary managem ent by making fisheri es managem ent control s more restric tive (i.e., decreas e TAC, decreas e allowab le effort, add or modify certain control s, etc.)

Limit >= Indicator

High fishing pressure has caused an ecosystem state change; fishery in danger of collapse

Red

  1. Close fishery and

  2. Impleme nt fishery recover y plan

Extreme environment al stochastici ty has caused an ecosystem state change; fishery in danger of collapse

Red

  1. Close fishery and

  2. Impleme nt fishery recover y plan

Coral Reef Thresholds (aggregated across species)

Unfished biomass Indicator >= Target

And

fished:unfi shed biomass ratio >= Target

Fishing pressure appropriate for maintaining or improving the health of the ecosystem

Green

  1. Make no changes to fisheri es managem ent control s *or
  1. If trends have persist ed for more than one year and there is no reason to believe precaut ionary managem ent is necessa ry, make fisheri es managem ent control s less restric tive (i.e., increas e TAC, increas e effort cap, etc.)

Unfished area has a low biomass and does not represent a healthy virgin area (significan t illegal fishing is occurring within the NTZ)

Yellow

  1. Conside r improve d enforce ment of NTZ and

  2. Conside r targete d social marketi ng to improve complia nce with NTZ and

  3. Conside r precaut ionary managem ent by making fisheri es managem ent control s more restric tive (i.e., decreas e TAC, decreas e allowab le effort, add or modify certain control s, etc.)

Unfished area has a low biomass and does not represent a healthy virgin area (NTZ is new and has not yet led to substantial improvement s in ecosystem health)

Yellow

  1. Conside r precaut ionary managem ent by making fisheri es managem ent control s more restric tive (i.e., decreas e TAC, decreas e allowab le effort, add or modify certain control s, etc.)

Unfished area has a low biomass and does not represent a healthy virgin area (NTZ is small with large amounts of species movement between fished and unfished areas)

Yellow

  1. Conside r expansi on or relocat ion of NTZ and
  1. Conside r precaut ionary managem ent by making fisheri es managem ent control s more restric tive (i.e., decreas e TAC, decreas e allowab le effort, add or modify certain control s, etc.)

Unfished area does not have comparable habitat to fished area (unfished area habitat not as healthy as fished area)

Yellow

  1. Conside r expansi on or relocat ion of NTZ and
  1. Conside r precaut ionary managem ent by making fisheri es managem ent control s more restric tive (i.e., decreas e TAC, decreas e allowab le effort, add or modify certain control s, etc.)

Limit <= Unfished biomass Indicator <= Target

And

Limit <= fished:unfi shed biomass ratio <= Target

High fishing pressure putting ecosystem at risk for impending state change

Yellow

  1. Make fisheri es managem ent control s more restric tive (i.e., decreas e TAC, decreas e effort cap, add or modify certain control s, expand NTZ, etc.)

Environment al stochastici ty putting ecosystem at risk for impending state change

Yellow

  1. Conside r precaut ionary managem ent by making fisheri es managem ent control s more restric tive (i.e., decreas e TAC, decreas e allowab le effort, add or modify certain control s, etc.)

Unfished area has a low density and does not represent a healthy virgin area (significan t illegal fishing is occurring within the NTZ)

Yellow

  1. Conside r improve d enforce ment of NTZ and

  2. Conside r targete d social marketi ng to improve complia nce with NTZ and

  3. Conside r precaut ionary managem ent by making fisheri es managem ent control s more restric tive (i.e., decreas e TAC, decreas e allowab le effort, add or modify certain control s, etc.)

Unfished area has a low density and does not represent a healthy virgin area (NTZ is new and has not yet led to substantial improvement s in ecosystem health)

Yellow

  1. Conside r precaut ionary managem ent by making fisheri es managem ent control s more restric tive (i.e., decreas e TAC, decreas e allowab le effort, add or modify certain control s, etc.)

Unfished area has a low density and does not represent a healthy virgin area (NTZ is small with large amounts of species movement between fished and unfished areas)

Yellow

  1. Conside r expansi on or relocat ion of NTZ and
  1. Conside r precaut ionary managem ent by making fisheri es managem ent control s more restric tive (i.e., decreas e TAC, decreas e allowab le effort, add or modify certain control s, etc.)

Unfished area does not have comparable habitat to fished area (unfished area habitat not as healthy as fished area)

Yellow

  1. Conside r expansi on or relocat ion of NTZ and
  1. Conside r precaut ionary managem ent by making fisheri es managem ent control s more restric tive (i.e., increas e TAC, increas e allowab le effort, add or modify certain control s, etc.)

Limit >= Unfished biomass Indicator

Or

Limit >= fished:unfi shed biomass ratio

High fishing pressure has caused an ecosystem state change; fishery in danger of collapse

Red

  1. Close fishery and
  1. Impleme nt fishery recover y plan

Extreme environment al stochastici ty has caused an ecosystem state change; fishery in danger of collapse

Red

  1. Close fishery and
  1. Impleme nt fishery recover y plan
Table 4.2: Indicators for Tiers 2 and 3: Possible interpretations, management implications, and suggested harvest control rules
Performan ce Indicator Assessmen t Result Interpret ation Result Managemen t Response

Fishing Mortality (F)

Indicator >= Limit

High fishing pressure negatively affecting size structure and spawning stock biomass; fishery in danger of collapse

Red

  1. Close fishery and

  2. Impleme nt fishery recover y plan

Extreme environment al stochastici ty negatively affecting size structure and spawning stock biomass; fishery in danger of collapse

Red

  1. Close fishery and

  2. Impleme nt fishery recover y plan

Limit > Indicator > Target

High fishing pressure affecting size structure and spawning stock biomass

Yellow

  1. Make fisheri es managem ent control s more restric tive (i.e., decreas e TAC, decreas e effort cap, add or modify certain control s, expand NTZ, etc.)

Fishers targeting nursery grounds

Yellow

  1. Make fisheri es managem ent control s more restric tive (i.e., decreas e TAC, decreas e effort cap, add or modify certain control s, expand NTZ, etc.)

Gear shift towards less selective gear (more small individuals in catch)

Yellow

  1. Conside r impleme nting a gear restric tion on less selecti ve gear and/ or

  2. Conside r impleme nting a minimum size limit (if one does not already exist)

Strong recruitment pulse (more small individuals entering the catch)

Green

  1. Make no changes to fisheri es managem ent control s *or
  1. If trends have persist ed for more than one year and there is no reason to believe precaut ionary managem ent is necessa ry, make fisheri es managem ent control s less restric tive (i.e., increas e TAC, increas e allowab le effort, remove or modify certain control s, etc.)

Market selectivity for smaller individuals

Yellow

  1. Conside r impleme nting a minimum size limit (if one does not already exist)

Emigration of large individuals from fishing area

Green

  1. Make no changes to fisheri es managem ent control s

Environment al stochastici ty affecting size structure and spawning stock biomass

Yellow

  1. Conside r precaut ionary managem ent by making fisheri es managem ent control s more restric tive (i.e., decreas e TAC, decreas e allowab le effort, add or modify certain control s, etc.)

Target >= Indicator

Fishing pressure appropriate for maintaining or improving size structure of population

Green

  1. Make no changes to fisheri es managem ent control s *or
  1. If trends have persist ed for more than one year and there is no reason to believe precaut ionary managem ent is necessa ry, make fisheri es managem ent control s less restric tive (i.e., increas e TAC, increas e allowab le effort, remove or modify certain control s, etc.)

Gear shift towards more selective gear (fewer small individuals in catch)

Green

  1. Make no changes to fisheri es managem ent control s *or
  1. If trends have persist ed for more than one year and there is no reason to believe precaut ionary managem ent is necessa ry, make fisheri es managem ent control s less restric tive (i.e., increas e TAC, increas e allowab le effort, remove or modify certain control s, etc.)

Market selectivity for larger individuals

Yellow

  1. Conside r impleme nting a maximum size limit (if one does not already exist)

Weak recruitment pulse (fewer small individuals entering the catch)

Yellow

  1. Conside r precaut ionary managem ent by making fisheri es managem ent control s more restric tive (i.e., decreas e TAC, decreas e allowab le effort, add or modify certain control s, etc.)

Immigration of large individuals to fishing area

Green

  1. Make no changes to fisheri es managem ent control s

Average Length

Indicator <= Limit

High fishing pressure negatively affecting size structure and spawning stock biomass; fishery in danger of collapse

Red

  1. Close fishery and
  1. Impleme nt fishery recover y plan

Extreme environment al stochastici ty negatively affecting size structure and spawning stock biomass; fishery in danger of collapse

Red

  1. Close fishery and

  2. Impleme nt fishery recover y plan

Limit < Indicator < Target

High fishing pressure affecting size structure and spawning stock biomass

Yellow

  1. Make fisheri es managem ent control s more restric tive (i.e., decreas e TAC, decreas e effort cap, add or modify certain control s, expand NTZ, etc.)

Fishers targeting nursery grounds

Yellow

  1. Make fisheri es managem ent control s more restric tive (i.e., decreas e TAC, decreas e effort cap, add or modify certain control s, expand NTZ, etc.)

Gear shift towards less selective gear (more small individuals in catch)

Yellow

  1. Conside r impleme nting a gear restric tion on less selecti ve gear and/ or
  1. Conside r impleme nting a minimum size limit (if one does not already exist)

Strong recruitment pulse (more small individuals entering the catch)

Green

  1. Make no changes to fisheri es managem ent control s *or
  1. If trends have persist ed for more than one year and there is no reason to believe precaut ionary managem ent is necessa ry, make fisheri es managem ent control s less restric tive (i.e., increas e TAC, increas e allowab le effort, remove or modify certain control s, etc.)

Market selectivity for smaller individuals

Yellow

  1. Conside r impleme nting a minimum size limit (if one does not already exist) *or
  1. Conside r precaut ionary managem ent by making fisheri es managem ent control s more restric tive (i.e., decreas e TAC, decreas e allowab le effort, add or modify certain control s, etc.)

Emigration of large individuals from fishing area

Green

  1. Make no changes to fisheri es managem ent control s

Environment al stochastici ty affecting size structure and spawning stock biomass

Yellow

  1. Conside r precaut ionary managem ent by making fisheri es managem ent control s more restric tive (i.e., decreas e TAC, decreas e allowab le effort, add or modify certain control s, etc.)

Target <= Indicator

Fishing pressure appropriate for maintaining or improving size structure of population

Green

  1. Make no changes to fisheri es managem ent control s *or
  1. If trends have persist ed for more than one year and there is no reason to believe precaut ionary managem ent is necessa ry, make fisheri es managem ent control s less restric tive (i.e., increas e TAC, increas e allowab le effort, remove or modify certain control s, etc.)

Gear shift towards more selective gear (fewer small individuals in catch)

Green

  1. Make no changes to fisheri es managem ent control s *or
  1. If trends have persist ed for more than one year and there is no reason to believe precaut ionary managem ent is necessa ry, make fisheri es managem ent control s less restric tive (i.e., increas e TAC, increas e allowab le effort, remove or modify certain control s, etc.)

Market selectivity for larger individuals

Yellow

  1. Conside r impleme nting a maximum size limit (if one does not already exist) *or
  1. Conside r precaut ionary managem ent by making fisheri es managem ent control s more restric tive (i.e., decreas e TAC, decreas e allowab le effort, add or modify certain control s, etc.)

Weak recruitment pulse (fewer small individuals entering the catch)

Yellow

  1. Conside r precaut ionary managem ent by making fisheri es managem ent control s more restric tive (i.e., decreas e TAC, decreas e allowab le effort, add or modify certain control s, etc.)

Immigration of large individuals to fishing area

Green

  1. Make no changes to fisheri es managem ent control s

Spawning Potential Ratio

Indicator <= Limit

High fishing pressure affecting size structure and spawning stock biomass; fishery in danger of collapse

Red

  1. Close fishery and

  2. Impleme nt fishery recover y plan

Extreme environment al stochastici ty affecting size structure and spawning stock biomass; fishery in danger of collapse

Red

  1. Close fishery and

  2. Impleme nt fishery recover y plan

Limit > Indicator < Target

High fishing pressure affecting size structure and spawning stock biomass

Yellow

  1. Make fisheri es managem ent control s more restric tive (i.e., decreas e TAC, decreas e effort cap, add or modify certain control s, expand NTZ, etc.)

Fishers targeting nursery grounds

Yellow

  1. Make fisheri es managem ent control s more restric tive (i.e., decreas e TAC, decreas e effort cap, add or modify certain control s, expand NTZ, etc.)

Gear shift towards less selective gear (more small individuals in catch)

Yellow

  1. Conside r impleme nting a gear restric tion on less selecti ve gear and/ or

  2. Conside r impleme nting a minimum size limit (if one does not already exist)

Strong recruitment pulse (more small individuals entering the catch)

Green

  1. Make no changes to fisheri es managem ent control s *or
  1. If trends have persist ed for more than one year and there is no reason to believe precaut ionary managem ent is necessa ry, make fisheri es managem ent control s less restric tive (i.e., increas e TAC, increas e effort cap, etc.)

Market selectivity for smaller individuals

Yellow

  1. Conside r impleme nting a minimum size limit (if one does not already exist) *or
  1. Conside r precaut ionary managem ent by making fisheri es managem ent control s more restric tive (i.e., decreas e TAC, decreas e allowab le effort, add or modify certain control s, etc.)

Emigration of large individuals from fishing area

Green

  1. Make no changes to fisheri es managem ent control s

Environment al stochastici ty affecting size structure and spawning stock biomass

Yellow

  1. Conside r precaut ionary managem ent by making fisheri es managem ent control s more restric tive (i.e., decreas e TAC, decreas e allowab le effort, add or modify certain control s, etc.)

Target <= Indicator

Fishing pressure appropriate for maintaining or improving size structure of population and spawning stock biomass

Green

  1. Make no changes to fisheri es managem ent control s *or
  1. If trends have persist ed for more than one year and there is no reason to believe precaut ionary managem ent is necessa ry, make fisheri es managem ent control s less restric tive (i.e., increas e TAC, increas e effort cap, etc.)

Gear shift towards more selective gear (fewer small individuals in catch)

Green

  1. Make no changes to fisheri es managem ent control s *or
  1. If trends have persist ed for more than one year and there is no reason to believe precaut ionary managem ent is necessa ry, make fisheri es managem ent control s less restric tive (i.e., increas e TAC, increas e effort cap, etc.)

Market selectivity for larger individuals

Yellow

  1. Conside r impleme nting a maximum size limit (if one does not already exist) *or
  1. Conside r precaut ionary managem ent by making fisheri es managem ent control s more restric tive (i.e., decreas e TAC, decreas e allowab le effort, add or modify certain control s, etc.)

Weak recruitment pulse (fewer small individuals entering the catch)

Yellow

  1. Conside r precaut ionary managem ent by making fisheri es managem ent control s more restric tive (i.e., decreas e TAC, decreas e allowab le effort, add or modify certain control s, etc.)

Immigration of large individuals to fishing area

Green

  1. Make no changes to fisheri es managem ent control s *or

Froese Indicators

All Indicators at or better than Target (Lopt=100%, Lmat>90% , Lmega<30 %)

Fishing pressure appropriate for maintaining or improving size structure of population and spawning stock biomass

Green

  1. Make no changes to fisheri es managem ent control s *or
  1. If trends have persist ed for more than one year and there is no reason to believe precaut ionary managem ent is necessa ry, make fisheri es managem ent control s less restric tive (i.e., increas e TAC, increas e effort cap, etc.)

Gear shift towards more or less selective gear

Yellow

  1. Conside r precaut ionary managem ent by making fisheri es managem ent control s more restric tive (i.e., decreas e TAC, decreas e allowab le effort, add or modify certain control s, etc.)

Change in recruitment

Yellow

  1. Conside r precaut ionary managem ent by making fisheri es managem ent control s more restric tive (i.e., decreas e TAC, decreas e allowab le effort, add or modify certain control s, etc.)

Change in spatial distributio n of stock

Yellow

  1. Conside r precaut ionary managem ent by making fisheri es managem ent control s more restric tive (i.e., decreas e TAC, decreas e allowab le effort, add or modify certain control s, etc.)

Target > Lopt > Limit

And/or

Target > Lmat > Limit

Market selectivity for smaller individuals

Yellow

  1. Conside r impleme nting a minimum size limit (if one does not already exist) *or
  1. Conside r precaut ionary managem ent by making fisheri es managem ent control s more restric tive (i.e., decreas e TAC, decreas e allowab le effort, add or modify certain control s, etc.)

High fishing pressure affecting size structure and spawning stock biomass

Yellow

  1. Make fisheri es managem ent control s more restric tive (i.e., decreas e TAC, decreas e effort cap, add or modify certain control s, expand NTZ, etc.)

Fishers targeting nursery grounds

Yellow

  1. Make fisheri es managem ent control s more restric tive (i.e., decreas e TAC, decreas e effort cap, add or modify certain control s, expand NTZ, etc.)

Strong recruitment pulse (more small individuals entering the catch)

Green

  1. Make no changes to fisheri es managem ent control s *or
  1. If trends have persist ed for more than one year and there is no reason to believe precaut ionary managem ent is necessa ry, make fisheri es managem ent control s less restric tive (i.e., increas e TAC, increas e allowab le effort, remove or modify certain control s, etc.)

Emigration of large individuals from fishing area

Green

  1. Make no changes to fisheri es managem ent control s

Environment al stochastici ty affecting size structure and spawning stock biomass

Yellow

  1. Conside r precaut ionary managem ent by making fisheri es managem ent control s more restric tive (i.e., increas e TAC, increas e allowab le effort, add or modify certain control s, etc.)

Limit > Lmega > Target

Market selectivity for larger individuals

Yellow

  1. Conside r impleme nting a maximum size limit (if one does not already exist) *or
  1. Conside r precaut ionary managem ent by making fisheri es managem ent control s more restric tive (i.e., decreas e TAC, decreas e allowab le effort, add or modify certain control s, etc.)

High fishing pressure affecting size structure and spawning stock biomass

Yellow

  1. Make fisheri es managem ent control s more restric tive (i.e., decreas e TAC, decreas e effort cap, add or modify certain control s, expand NTZ, etc.)

Weak recruitment pulse (fewer small individuals entering the catch)

Yellow

  1. Conside r precaut ionary managem ent by making fisheri es managem ent control s more restric tive (i.e., decreas e TAC, decreas e allowab le effort, add or modify certain control s, etc.)

Immigration of large individuals to fishing area

Green

  1. Make no changes to fisheri es managem ent control s *or

Lopt < Limit (Lopt<80 %)

High fishing pressure affecting size structure and spawning stock biomass; fishery in danger of collapse

Red

  1. Close fishery and

  2. Impleme nt fishery recover y plan

Lmat < Limit (Lmat<50 %)

High fishing pressure affecting size structure and spawning stock biomass; fishery in danger of collapse

Red

  1. Close fishery and

  2. Impleme nt fishery recover y plan

Lmega < Limit (Lmega < 20%)

High fishing pressure affecting size structure and spawning stock biomass; fishery in danger of collapse

Red

  1. Close fishery and

  2. Impleme nt fishery recover y plan

Table 4.3: Indicators for Tier 3: Possible interpretations, management implications, and suggested harvest control rules
Performan ce Indicator Assessmen t Result Interpret ation Result Managemen t Response

CPUE

Indicator >= Target

Fishing pressure appropriate for maintaining or improving spawning stock biomass

Green

  1. Make no changes to fisheri es managem ent control s *or
  1. If trends have persist ed for more than one year and there is no reason to believe precaut ionary managem ent is necessa ry, make fisheri es managem ent control s less restric tive (i.e., increas e TAC, increas e allowab le effort, remove or modify certain control s, etc.)

Change to more efficient gear type

Yellow

  1. Conside r impleme nting a gear restric tion on less selecti ve gear and/ or

  2. Conside r impleme nting a minimum size limit (if one does not already exist)

Serial depletion (fishers have moved from depleted fishing grounds to less depleted fishing grounds, such as offshore areas)

Yellow

  1. Make fisheri es managem ent control s more restric tive (i.e., increas e TAC, increas e effort cap, add or modify certain control s, expand NTZ, etc.)

Misreportin g of effort; reported effort too low

Yellow

  1. Modify catch reporti ng protoco ls and/ or

  2. Perform social marketi ng dedicat ed towards increas ing catch reporti ng complia nce and

  3. Conside r precaut ionary managem ent by making fisheri es managem ent control s more restric tive (i.e., increas e TAC, increas e allowab le effort, add or modify certain control s, etc.)

Fishing of spawning aggregation s / hyperstabil ity

Yellow

  1. Ban fishing of spawnin g aggrega tions

Target > Indicator > Limit

Environment al stochastici ty negatively affecting spawning stock biomass

Yellow

  1. Conside r precaut ionary managem ent by making fisheri es managem ent control s more restric tive (i.e., increas e TAC, increas e allowab le effort, add or modify certain control s, etc.)

Change to less efficient gear type

Green

  1. Make no changes to fisheri es managem ent control s *or
  1. If trends have persist ed for more than one year and there is no reason to believe precaut ionary managem ent is necessa ry, make fisheri es managem ent control s less restric tive (i.e., increas e TAC, increas e allowab le effort, remove or modify certain control s, etc.)

Misreportin g of effort; reported effort too high

Yellow

  1. Modify catch reporti ng protoco ls and/ or

  2. Perform social marketi ng dedicat ed towards increas ing catch reporti ng complia nce and

  3. Conside r precaut ionary managem ent by making fisheri es managem ent control s more restric tive (i.e., increas e TAC, increas e allowab le effort, add or modify certain control s, etc.)

High fishing pressure negatively affecting spawning stock biomass

Yellow

  1. Make fisheri es managem ent control s more restric tive (i.e., increas e TAC, increas e effort cap, add or modify certain control s, expand NTZ, etc.)

Limit >= Indicator

High fishing pressure negatively affecting spawning stock biomass; fishery in danger of collapse

Red

  1. Close fishery and

  2. Impleme nt fishery recover y plan

Previous Year’s Total Landings

Indicator >= Target

Fishing pressure appropriate for maintaining or improving spawning stock biomass

Green

  1. Make no changes to fisheri es managem ent control s *or
  1. If trends have persist ed for more than one year and there is no reason to believe precaut ionary managem ent is necessa ry, make fisheri es managem ent control s less restric tive (i.e., increas e TAC, increas e allowab le effort, remove or modify certain control s, etc.)

Fishing effort increased last year

Yellow

  1. Conside r precaut ionary managem ent by making fisheri es managem ent control s more restric tive (i.e., increas e TAC, increas e allowab le effort, add or modify certain control s, etc.)

Misreportin g of landings; reported catch too high

Yellow

  1. Modify catch reporti ng protoco ls and/ or

  2. Perform social marketi ng dedicat ed towards increas ing catch reporti ng complia nce and

  3. Conside r precaut ionary managem ent by making fisheri es managem ent control s more restric tive (i.e., decreas e TAC, decreas e allowab le effort, add or modify certain control s, etc.)

Target > Indicator > Limit

High fishing pressure negatively affecting spawning stock biomass

Yellow

  1. Make fisheri es managem ent control s more restric tive (i.e., decreas e TAC, decreas e effort cap, add or modify certain control s, expand NTZ, etc.)

Fishing effort decreased last year

Green

  1. Make no changes to fisheri es managem ent control s *or
  1. If trends have persist ed for more than one year and there is no reason to believe precaut ionary managem ent is necessa ry, make fisheri es managem ent control s less restric tive (i.e., increas e TAC, increas e allowab le effort, remove or modify certain control s, etc.)

Misreportin g of landings; reported catch too low

Yellow

  1. Modify catch reporti ng protoco ls and/ or

  2. Perform social marketi ng dedicat ed towards increas ing catch reporti ng complia nce and

  3. Conside r precaut ionary managem ent by making fisheri es managem ent control s more restric tive (i.e., decreas e TAC, decreas e allowab le effort, add or modify certain control s, etc.)

Limit >= Indicator

High fishing pressure negatively affecting spawning stock biomass; fishery in danger of collapse

Red

  1. Close fishery and

  2. Impleme nt fishery recover y plan